ANA datasets
Updated: 2026-06-10
Download data from ANA’s gauges stations
Overview
This documentation describes the computational pipeline developed in R [6] for the automated acquisition, standardisation, and organisation of hydrometeorological historical series retrieved from the HidroSerieHistorica WebService of the National Water and Basic Sanitation Agency (ANA) [1]. The system operates on three observational variables — precipitation, river stage (water level), and discharge — covering the climatological normals defined by the National Institute of Meteorology (INMET). The solution was designed to overcome the operational limitations of manual and pre-existing tools [4] [8], providing curated, high-granularity datasets suitable for advanced hydrological modelling and machine learning applications.
Data Scope and Temporal Coverage
The pipeline processes three types of hydrometeorological variables extracted through XML responses obtained via requests to the ANA WebService:
River stage / Water level (
tipo_dados = "1") — fieldsCota01toCota31Precipitation (
tipo_dados = "2") — fieldsChuva01toChuva31Discharge (
tipo_dados = "3") — fieldsVazao01toVazao31
A critical advantage of this solution is the acquisition of raw daily series, preserving the granularity required for modelling extreme hydrometeorological events, as opposed to aggregated averages, which are the data format most commonly provided by secondary sources.
The temporal coverage is based on the INMET climatological normals, structured in 30-year windows [11]:
Code |
Period |
1 |
1961–1990 |
2 |
1991–2020 |
3 |
2021–2024 |
Code 3 represents the period of data available from 2021 onwards, corresponding to the interval that may compose the next complete climatological normal.
Distinction between end_date and DataInicioOperacao
It is important to distinguish two central temporal parameters of the pipeline:
end_date— defines the end date of the period of interest for the selected climatological normal (e.g.,1990-12-31for normal 1, or2020-12-31for normal 2). This parameter sets the search horizon for historical series in the ANA WebService and is fixed according to the temporal window of the chosen normal.DataInicioOperacao— is a registration attribute of each station, computed from the start dates of the installed instruments (rain gauges, water level recorders, telemetric sensors, among others). It represents the date from which the station began generating observational records.
Whereas end_date is a pipeline configuration parameter — set by the user based on the desired climatological normal — DataInicioOperacao is an intrinsic property of each station, used as a filtering criterion to determine which stations are likely to hold records within the requested period.
Station eligibility is determined by a cutoff point calculated from end_date:
corte_final = end_date − 1 year + 1 day
Only stations whose DataInicioOperacao is on or before corte_final are included in the processing workflow. This strategy ensures that only stations potentially holding at least one full year of records within the climatological normal of interest are submitted to the download process, thereby reducing unnecessary requests to the WebService.
Note
DataInicioOperacao is computed as described in section Start and end dates of operation, based on the start dates of the instruments installed at each station. The end-of-operation date (DataFimOperacao) is not used as an exclusion criterion: a substantial proportion of registered stations — 57.7% of rainfall stations and 50.5% of streamflow stations — do not have this information available. Furthermore, cases were identified in which stations with a recorded DataFimOperacao still presented data in subsequent periods, which would have resulted in the unwarranted exclusion of valid records.
Technology Stack and Computational Environment
The pipeline was developed entirely in R, prioritising libraries that ensure robustness in external communication, task parallelisation, and efficient storage of large volumes of environmental data. The technology stack was selected to favour solutions with active community support and broad adoption in environmental data analysis research.
HTTP Communication
httr2[9] — manages interaction with the ANA WebService, with support for automatic retry and exponential backoff.
XML Processing
xml2[10] — performs structured parsing of institutional responses, with namespace removal to simplify XPath queries.
Data manipulation and transformation
tidyverse(dplyr,purrr,tidyr,stringr) [10] — cleaning and tabular structuring of time series.lubridate— date and period manipulation.
Parallelisation
future,doFuture,foreach[3] — asynchronous execution of monthly post-processing.
Data persistence
arrow[7] — final storage in Parquet format with gzip compression.
The execution environment was configured with 12 workers operating under a multisession plan, aimed at optimising processing time by enabling each worker to process different months of the same station simultaneously, without compromising system stability or overloading the remote service:
plan(multisession, workers = 12)
registerDoFuture()
Resilient Communication Architecture
The pipeline implements a resilient communication architecture, differentiating itself from approaches based on simple, sequential requests that are frequently susceptible to network instabilities and traffic-overload blocking [8]. Pre-existing tools such as SisCAH, SiADH, and the hydrobr package [4], although useful, lacked explicit fault-tolerance mechanisms, which compromised the continuity of large-scale data collection. The set of strategies described below was designed to overcome these limitations, ensuring a higher success rate in the extraction of large data volumes.
Automatic Retry
In large-scale data collection scenarios, transient communication failures are unavoidable and may arise from network instability, momentary server overload, or incomplete service responses. To ensure processing continuity without manual intervention, the pipeline implements an automatic retry mechanism that re-executes the same request up to six times before classifying the station as a technical failure:
req_retry(max_tries = 6, ...)
This mechanism is activated for transient failures, including network errors, momentary server overload, and unstable HTTP responses. Without automatic retry, any minor network fluctuation could interrupt the processing of an entire station, requiring manual restart and compromising record consistency.
Exponential Backoff
Repeating requests in immediate succession after a failure can exacerbate the load on an unstable server, increasing the risk of further errors. To address this issue, the pipeline adopts an exponential backoff strategy, in which the interval between retry attempts increases progressively, respecting the server’s recovery time:
backoff = function(attempt) min(90, 2^(attempt - 1))
The resulting sequence is:
Attempt |
Wait (seconds) |
1 |
1 |
2 |
2 |
3 |
4 |
4 |
8 |
5 |
16 |
6 |
32 (max. 90 s) |
This approach distributes retry attempts more evenly over time, reduces pressure on the remote service, and increases the probability of success under transient failure conditions — constituting a well-established fault-tolerance strategy in distributed systems [5].
HTTP Error Handling
Beyond network failures, the institutional WebService may return HTTP status codes indicating manageable error conditions. The pipeline identifies and responds to these situations automatically, without interrupting the collection workflow. The following are considered transient failures eligible for retry:
HTTP 429 (Too Many Requests) — indicates that the request rate limit per unit of time has been exceeded. This condition typically arises when multiple stations are processed in rapid succession, and is mitigated by the combination of exponential backoff and programmatic pauses between batches.
HTTP 5xx — server-side errors (500, 502, 503, 504), which indicate temporary service unavailability and typically resolve within a few minutes.
Each request is subject to a timeout of 180 seconds to prevent stalled calls from blocking pipeline execution indefinitely.
Load Control
In addition to the reactive retry and backoff mechanisms, the pipeline adopts a proactive load control strategy by inserting programmatic pauses at different levels of the process. This approach reduces the risk of saturating the institutional WebService and contributes to stable, large-scale extraction in compliance with the response capacity of the national repository:
6 seconds between consecutive station requests.
60 seconds after every batch of 30 processed stations.
120 seconds at each transition between Brazilian states (UF).
Series Selection and Validation Criteria
When responding to a request, the ANA WebService may return multiple concurrent monthly series for the same station and period. This overlap results from the coexistence of raw and consistent records in the national repository. To address this redundancy, the algorithm implements a deterministic selection model based on a strict hierarchy of technical criteria, ensuring that only the most representative series for each month is included in the final dataset.
Primary Criterion (DataHora)
Series are prioritised according to the reference date (DataHora), following the structural logic of the institutional database, in which complete monthly series tend to be indexed by the first day of the month:
Series whose
DataHorafalls on the first day of the month.If absent, series with
DataHoraon the last day of the month.If absent, any series with
DataHorawithin the month.
Tiebreaking Criteria
In the event of a tie between candidates satisfying the same primary criterion, the algorithm applies a tiebreaking hierarchy oriented by data quality and recency:
Highest
NivelConsistencia(Level 2 — Consistent, over Level 1 — Raw).Shortest distance in days to the first day of the month.
Presence of
DataIns(records with an insertion metadata field take priority).Most recent
DataIns— ensures that corrections and revisions subsequently made by ANA are incorporated into the final dataset.
Note
Approximately 76% of the selected monthly series, considering precipitation data for the period 1991–2020, corresponded to Level 2 (consistent) data, indicating a high proportion of records that had already undergone institutional quality control.
Daily Parsing and Calendar Reconstruction
Following the selection of the best monthly series, the pipeline performs daily parsing, individually extracting the observation fields (e.g., Chuva01 to Chuva31) along with their corresponding Status fields. Status is a quality indicator associated with each daily record and follows the ANA institutional encoding:
Code |
Classification |
Description |
0 |
Blank |
No quality information available. |
1 |
Observed |
Direct observation, considered most reliable. |
2 |
Estimated |
Value inferred by interpolation or indirect method. |
3 |
Doubtful |
Record suspected of inconsistency. |
4 |
Accumulated |
Value represents accumulation over multiple periods. |
Months with no data are filled with NA, preserving the temporal continuity of the dataset. Intra-monthly anomalies are handled by retaining the daily record with the lowest valid Status > 0, given that, in ANA’s encoding, lower positive numeric values indicate observations of higher reliability and superior levels of technical validation. This logic mitigates spurious duplications and enhances the robustness of the consolidated series.
Parallelised Processing and Temporal Consolidation
The parallelisation strategy adopted differs from conventional approaches: rather than parallelising HTTP requests across stations — which would significantly increase the risk of HTTP 429 blocking and could saturate the remote service — the pipeline parallelises the monthly post-processing within the response of a single station. This architecture delivers performance gains without compromising the stability of requests to the ANA WebService.
foreach(mes = meses, .combine = bind_rows) %dofuture% {
  # monthly series processing
}
Solution for xml2 External Pointers
xml2 objects are not serialisable for parallel processes because they are based on external C pointers. Attempting to send an XML object directly to workers would generate the error external pointer is not valid, interrupting processing. The adopted solution circumvents this limitation in two steps:
Extract each
<SerieHistorica>node as an XML string before sending it to the workers.Reconstruct the XML internally within each worker using an artificial wrapper:
<root xmlns:diffgr="..." xmlns:msdata="...">
  <!-- SerieHistorica fragment -->
</root>
This wrapper provides a valid root node and reinstalls the namespaces required by the fragment’s attributes, preventing parsing warnings and ensuring the integrity of the reconstructed XML structure.
Final Consolidation
Following parallel processing, data are sorted chronologically to reconstruct complete daily calendars. Periods with no data are explicitly represented by NA values, which guarantees:
Temporal continuity of the series, eliminating distortions in rolling-window analyses or extreme-value statistics.
Consistent cardinality for merging with other temporal datasets.
Suitability for models such as SWAT (Soil and Water Assessment Tool), which require continuous records to adequately simulate hydrological cycle processes.
Metadata Generation and Reproducibility
The pipeline incorporates a robust system for generating metadata and analytical logs, ensuring quality control, traceability, and transparency at each stage of the process. Unlike manual queries, in which error histories are rarely documented, the algorithm records temporal transitions, years with missing records, and blocks of absent data, formatting messages to avoid redundancies and facilitate subsequent human review.
Station Classification
Each processed station is automatically classified into one of three distinct semantic categories, enabling the differentiation of genuine data absences from technical extraction failures:
With valid data — complete return with at least one real record (non-
NA).No data in the period — successful request, but no records found within the requested interval. Archived separately to avoid contaminating the final dataset.
Technical failure — persistent connection errors after the retry cycle, or XML parsing failures, isolated for subsequent technical audit.
Output Structure
For each state (UF), separate files are generated by result category, organised in standardised directories:
<variable>_data/
└── climate_normals_<N>_<start_year>_<end_year>/
    ├── long_data/          ← time series with valid data (one file per state)
    ├── nodata_gauges/      ← stations with no data in the period
    └── problem_gauges/     ← stations with technical failure
All files are stored in Parquet format with gzip compression, ensuring high read performance and volumetric efficiency.
Execution Summary
At the end of each state (UF), the system generates a consolidated summary table in both CSV and Parquet formats containing: total eligible stations, successful extractions, data absences, technical failures, and total elapsed processing time. This audit mechanism enables faithful reproduction of the collection process across different temporal windows, in alignment with best practices for research based on secondary data from institutional APIs.
Pipeline Diagram
The diagram below represents the complete pipeline workflow, from the loading of the station inventory to the persistence of data by state.
        flowchart TB
  A["Load station inventory"]:::configCode
  B["Select climatological normal"]:::configCode

  C["Loop by state (UF)"]:::reqCode
  D["Filter eligible stations (DataInicioOperacao ≤ corte_final)"]:::reqCode
  E["Loop by station"]:::reqCode
  F["HTTP request to ANA WebService (httr2 + retry + backoff)"]:::reqCode
  G{"Valid response?"}:::reqCode
  G_no["Log to error_list → continue"]:::reqCode

  G_yes["Parse XML (xml2 + ns_strip)"]:::validacao
  H{"<Error> node?"}:::validacao
  H_yes["Return NA calendar"]:::validacao
  H_no["Extract <SerieHistorica> nodes"]:::validacao
  I["Serialize series as strings (external pointers solution)"]:::validacao
  J["Parallel processing by month (foreach %dofuture%)"]:::validacao
  K["Select best monthly series (deterministic criteria)"]:::validacao
  L["Extract daily values (Chuva01–Chuva31 / Status / Consistence)"]:::validacao
  M["Consolidate station (complete daily calendar + NA)"]:::validacao

  N{"Classify result"}:::exportacao
  N1["values_list (valid data)"]:::exportacao
  N2["nodata_list (no data)"]:::exportacao
  N3["error_list (technical failure)"]:::exportacao
  O["Write Parquet (gzip) files by state (UF)"]:::exportacao
  P["Generate final summary CSV + Parquet"]:::exportacao

  A --> B --> C --> D --> E --> F --> G
  G -- "No" --> G_no --> E
  G -- "Yes" --> G_yes --> H
  H -- "Yes" --> H_yes --> M
  H -- "No" --> H_no --> I --> J --> K --> L --> M
  M --> N
  N --> N1 & N2 & N3
  N1 & N2 & N3 --> O --> P

  classDef configCode fill:#fff3e0,stroke:#ef6c00,color:#000;
  classDef reqCode fill:#e3f2fd,stroke:#1565c0,color:#000;
  classDef validacao fill:#e8f5e9,stroke:#2e7d32,color:#000;
  classDef exportacao fill:#ede7f6,stroke:#5e35b1,color:#000;
Results and Discussion
Overview of Obtained Data
The pipeline processed a total of 36,063 registered stations, comprising 19,985 rainfall stations and 16,078 streamflow stations distributed across the 27 Brazilian states. The dataset was restricted to stations with DataInicioOperacao on or before 01/01/2024, so as to ensure at least one complete year of data relative to the final reference date adopted (31/12/2024). This date was defined by the update latency observed in the ANA database, given that more recent records were still being entered into the system at the time of extraction, particularly for the year 2025.
Table 5 presents, for each data type and climatological normal period, the number of eligible stations and the corresponding number of stations that yielded at least one valid record during the extraction process (station coverage).
Type |
Eligible stations |
1961–1990 |
1991–2020 |
2021–2024 |
|---|---|---|---|---|
With data (%) |
With data (%) |
With data (%) |
||
Precipitation |
19,985 |
8,959 (77.0%) |
8,569 (43.8%) |
4,399 (22.0%) |
Stage |
16,078 |
4,174 (63.9%) |
4,660 (35.2%) |
2,576 (16.0%) |
Discharge |
16,078 |
2,557 (39.1%) |
2,589 (19.5%) |
1,746 (10.9%) |
Source: Original research results.
Note
The eligible station counts used as denominators in Table 5 correspond to the stations whose DataInicioOperacao falls on or before the corte_final threshold for each climatological normal, as described in the section Data Scope and Temporal Coverage. Stage and Discharge stations share the same eligibility universe (16,078), as both variables are measured at the same Type 1 streamflow stations. The lower coverage observed for Discharge relative to Stage reflects cases in which a station holds river level records but no discharge measurements for the requested period.
The coverage rates observed across all three data types decrease progressively as the climatological normal recedes further into the past, consistent with the historical expansion of the monitoring network. Precipitation stations presented the highest absolute coverage in the 1961–1990 normal (8,959 stations; 77.0%), reflecting the earlier establishment of the pluviometric network relative to the fluviometric network. For the 1991–2020 normal, precipitation coverage fell to 43.8% (8,569 stations), while stage and discharge coverage reached 35.2% (4,660) and 19.5% (2,589), respectively. Coverage rates for the 2021–2024 normal are the lowest across all types, as this period is still in progress and a substantial share of records had not yet been entered into the ANA repository at the time of extraction.
Computational Performance and Parallelisation Efficiency
Computational performance was evaluated using precipitation data from the 1991–2020 climatological normal, covering 19,582 eligible stations. This subset was selected as it represents a robust operational scenario with a high data volume and broad spatial coverage, providing adequate conditions for pipeline performance assessment. Results compare sequential and parallel (12 workers) processing, with identical parameters and datasets applied in both scenarios to ensure comparability.
The figure below illustrates the comparison of execution times across the two scenarios.
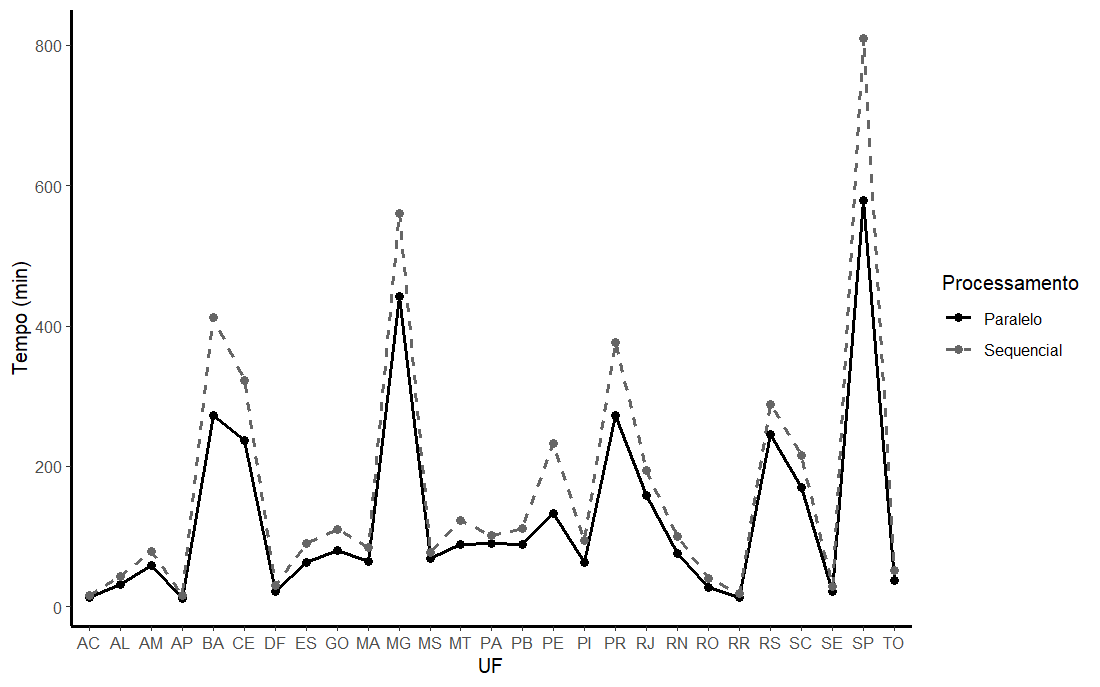
Figure 1 — Execution times for precipitation data retrieval (1991–2020). Parallel processing achieved a reduction of approximately 26% in total execution time relative to the sequential approach.
Scenario |
Total time |
Gain |
Sequential |
~4,629 min (77.1 h) |
— |
Parallel (12 workers) |
~3,430 min (57.2 h) |
~1.35× (~26%) |
Source: Original research results.
The performance gain was proportionally greater in states with denser monitoring networks, as the scaling of monthly tasks could be exploited more intensively. It should be noted that these values reflect a practical application subject to network latencies and the response limitations of the remote service, and therefore represent realistic operational benchmarks.
Quality and Consistency of the Extracted Dataset
This section presents two complementary perspectives on the quality of the extracted dataset: the consistency of the monthly series (Table 6) and the distribution of daily observation status flags across all retrieved records (Table 7).
Table 6 reports, for each data type and climatological normal, the total number of monthly series extracted from stations with data, the number of those series that received a consistency level of 2 (Consistent — indicating that the series has undergone institutional quality control by ANA), and the corresponding percentage.
Type |
Total monthly series |
1961–1990 |
1991–2020 |
2021–2024 |
|---|---|---|---|---|
Consistent (%) |
Consistent (%) |
Consistent (%) |
||
Precipitation |
— |
497,592 (15.4%) |
400,318 (13.0%) |
513 (0.24%) |
Stage |
— |
430,646 (28.7%) |
657,530 (39.2%) |
64,482 (52.2%) |
Discharge |
— |
413,589 (44.9%) |
531,333 (57.0%) |
51,428 (61.4%) |
Source: Original research results.
Note
The total monthly series for each combination is available in the underlying results object (result_monthly_consistence): 3,225,240 for Precipitation 1961–1990; 3,084,840 for 1991–2020; 211,152 for 2021–2024; 1,502,640 for Stage 1961–1990; 1,677,600 for 1991–2020; 123,648 for 2021–2024; 920,520 for Discharge 1961–1990; 932,040 for 1991–2020; and 83,808 for 2021–2024. The denominator includes all Code × YearMonth combinations present in the extracted data, including months for which no consistency classification was assigned (Consistence = NA).
Consistency rates for streamflow variables (Stage and Discharge) are substantially higher than for precipitation across all normal periods, and increase progressively toward more recent periods — reaching 52.2% and 61.4% for Stage and Discharge, respectively, in the 2021–2024 normal. Precipitation series show markedly lower consistency rates, with less than 1% of monthly series classified as consistent for the 2021–2024 normal, suggesting that quality control procedures for recent pluviometric data are still ongoing within the ANA system at the time of extraction.
Table 7 presents the distribution of daily observation status flags across all extracted records, expressed as a percentage of the total possible station-days for each combination of data type and climatological normal period. The denominator corresponds to the number of days in the period multiplied by the number of stations with data, thereby accounting for days with no record in the dataset. Status codes follow the ANA institutional encoding: 0 = Blank, 1 = Observed, 2 = Estimated, 3 = Doubtful, 4 = Accumulated. Records carrying status values outside this range are grouped under Others.
Status |
Type |
1961–1990 |
1991–2020 |
2021–2024 |
|---|---|---|---|---|
Days (%) |
Days (%) |
Days (%) |
||
0 — Blank |
Precipitation |
4,571,850 (4.66%) |
2,266,937 (2.41%) |
157,980 (2.46%) |
0 — Blank |
Stage |
364,532 (0.80%) |
412,919 (0.81%) |
73,155 (1.94%) |
0 — Blank |
Discharge |
431,876 (1.54%) |
763,595 (2.69%) |
67,043 (2.63%) |
1 — Observed |
Precipitation |
50,281,212 (51.2%) |
45,051,650 (48.0%) |
4,721,033 (73.5%) |
1 — Observed |
Stage |
15,477,065 (33.8%) |
20,492,026 (40.1%) |
2,545,808 (67.6%) |
1 — Observed |
Discharge |
11,697,081 (41.8%) |
14,499,620 (51.1%) |
1,711,193 (67.1%) |
2 — Estimated |
Precipitation |
13,045 (0.01%) |
28,384 (0.03%) |
1,147 (0.02%) |
2 — Estimated |
Stage |
676,829 (1.48%) |
1,413,806 (2.77%) |
146,948 (3.90%) |
2 — Estimated |
Discharge |
623,687 (2.23%) |
1,189,410 (4.19%) |
143,995 (5.64%) |
3 — Doubtful |
Precipitation |
5,196 (0.01%) |
98,257 (0.10%) |
20,812 (0.32%) |
3 — Doubtful |
Stage |
1,359 (0.00%) |
24,485 (0.05%) |
9,224 (0.25%) |
3 — Doubtful |
Discharge |
989 (0.00%) |
7,332 (0.03%) |
5,577 (0.22%) |
4 — Accumulated |
Precipitation |
16,669 (0.02%) |
40,025 (0.04%) |
14,451 (0.22%) |
4 — Accumulated |
Stage |
111,132 (0.24%) |
351,625 (0.69%) |
28,154 (0.75%) |
4 — Accumulated |
Discharge |
70,957 (0.25%) |
153,122 (0.54%) |
2,326 (0.09%) |
Others |
Precipitation |
0 (0.00%) |
3,212 (0.00%) |
0 (0.00%) |
Others |
Stage |
107,437 (0.23%) |
659,636 (1.29%) |
183,421 (4.87%) |
Others |
Discharge |
45,253 (0.16%) |
341,675 (1.20%) |
99,233 (3.89%) |
NA — No record |
Precipitation |
43,275,791 (44.1%) |
46,410,637 (49.4%) |
1,511,516 (23.5%) |
NA — No record |
Stage |
28,996,773 (63.4%) |
27,709,783 (54.3%) |
804,000 (21.4%) |
NA — No record |
Discharge |
15,148,206 (54.1%) |
11,415,508 (40.2%) |
521,509 (20.4%) |
Source: Original research results.
Note
The NA — No record category represents station-days within the period for which no observation was retrieved from the ANA WebService. This includes days that fall within the station’s operational window but for which no data were entered into the repository. The Others category aggregates all status codes outside the documented range (0–4), which were identified in the streamflow records (Stage and Discharge) only. These undocumented codes are not described in the current ANA data dictionary and are retained in the dataset for auditability.
Storage Efficiency and Data Organisation
Storage efficiency is a critical factor in applications involving large volumes of environmental time series. The adoption of Parquet format with gzip compression yielded substantial volumetric efficiency gains. Table 4 compares the total data volume for precipitation data (1991–2020) in CSV and Parquet formats, considering the same processed dataset.
Format |
Total size (MB) |
Reduction (%) |
|---|---|---|
CSV |
6,866 |
— |
Parquet (gzip) |
181 |
97.36% |
Source: Original research results.
The columnar structure of Parquet enables more effective compression, preserves variable typing, and allows selective reading of specific columns. Unlike the CSV format, which stores data as plain text without explicit typing, Parquet reduces redundancies and enables greater optimisation in data access operations. In the context of environmental Big Data applications, these characteristics make Parquet a more appropriate format for large-scale time series processing.
Pipeline Robustness and Error Handling
Pipeline robustness was evaluated through the analysis of execution logs generated during the data extraction run for the 1991–2020 climatological normal. The system differentiates three distinct operational situations, enabling granular monitoring of behaviour across success, data absence, and communication failure scenarios.
Normal execution with data
The system records job start/end timestamps, state-level headers, and per-station progress. When a station has missing months within a given year, each absent month is logged individually; when all months of a year are absent, the entire year is condensed into a single annual message, reducing log verbosity while preserving traceability.
--------------------------------------------------
Begin job:  Mon Mar  9 09:08:39 -03 2026
--------------------------------------------------
BAIXANDO DADOS DE CHUVA PARA ESTAÇÕES DA ANA - NORMAL CLIMATOLÓGICA: 2 - PERÍODO: 1991-01-01 ATÉ 2020-12-31

================================================================================
ESTADO: AC - TOTAL DE ESTAÇÕES CADASTRADAS: 76
TOTAL DE ESTAÇÕES COM POSSIBILIDADE DE DADOS NO PERÍODO: 76
================================================================================

[1/76] Baixando dados da estação 1067000

Estação 1067000 sem dados no MÊS 03/1991.
Estação 1067000 sem dados no MÊS 04/1991.
Estação 1067000 sem dados no MÊS 05/1991.
...
Estação 1067000 sem dados no MÊS 12/1991.

Estação 1067000 sem dados no ANO 1992.
Estação 1067000 sem dados no ANO 1993.
...
Estação 1067000 sem dados no ANO 2020.

Processamento de dados da estação 1067000: 2.93 segundos
Station with no data in the period
When the WebService returns a valid response but with no records in the requested interval, the pipeline logs a dedicated Erro message distinguishing this case from a technical failure. The station is classified in the nodata category and processing continues normally.
[29/76] Baixando dados da estação 772005

Erro - Estacao 772005: Sem dados para esta estação (Código: 772005) no período solicitado!

 Processamento de dados da estação 772005: 0.07 segundos


[30/76] Baixando dados da estação 772006

Erro - Estacao 772006: Sem dados para esta estação (Código: 772006) no período solicitado!

 Processamento de dados da estação 772006: 0.08 segundos


[31/76] Baixando dados da estação 772007

Estação 772007 sem dados no ANO 1991.
Estação 772007 sem dados no ANO 1992.
...
Estação 772007 sem dados no ANO 2016.

Estação 772007 sem dados no MÊS 01/2017.
Estação 772007 sem dados no MÊS 02/2017.
...
Estação 772007 sem dados no MÊS 08/2017.
Communication failures and load control
When a batch of 30 stations is completed, the system inserts an automatic pause logged as || Pausa automática para evitar sobrecarga no servidor.... At the end of each state, the system confirms whether any technical failures occurred, prints the output file path, and announces the 120-second pause before the next state begins.
[75/76] Baixando dados da estação 971003

Erro - Estacao 971003: Sem dados para esta estação (Código: 971003) no período solicitado!

 Processamento de dados da estação 971003: 0.07 segundos

|| Pausa automática para evitar sobrecarga no servidor...

[76/76] Baixando dados da estação 972000

Estação 972000 sem dados no MÊS 11/2003.
Estação 972000 sem dados no MÊS 12/2003.
...
Estação 972000 sem dados no MÊS 04/2013.

 Processamento de dados da estação 972000: 4.96 segundos

Sem falhas no download de estações para estado AC. Não foi gerado arquivo de erros.

================================================================================
ESTADO AC CONCLUÍDO. DADOS ARMAZENADOS EM:
/OPT/STORAGE/RAW/WCLIMATE/BIOCLIMATIC/ANA//PRECIPITATION_DATA/CLIMATE_NORMALS_2_1991_2020/LONG_DATA/PREC_DATA_LONG_AC_ANA.PARQUET
PREPARANDO PRÓXIMA EXECUÇÃO EM 120 SEGUNDOS...
================================================================================

================================================================================
ESTADO: AL - TOTAL DE ESTAÇÕES CADASTRADAS: 218
TOTAL DE ESTAÇÕES COM POSSIBILIDADE DE DADOS NO PERÍODO: 203
================================================================================
Consolidated execution report
At the end of the full run, the system generates and saves a tibble-format summary covering all 27 states, with columns for total stations, successful extractions, data absences, technical failures, elapsed time, and output file paths.
================================================================
Download finalizado.
Resumo da execução por estado:
# A tibble: 27 × 9
   Estado Total_Estacoes Sucesso Sem_Dados Falha Tempo_min Arquivo_Dados
   <chr>          <int>   <int>     <int> <int>     <dbl> <chr>
 1 AC               76      41        35     0      12.8  /opt/storage/raw/wcl...
 2 AL              203      65       138     0      31.4  /opt/storage/raw/wcl...
 3 AM              297     215        82     0      59.1  /opt/storage/raw/wcl...
 4 AP               69      29        40     0      11.3  /opt/storage/raw/wcl...
 5 BA             1698     715       983     0     272.   /opt/storage/raw/wcl...
 6 CE             1295     960       335     0     237.   /opt/storage/raw/wcl...
 7 DF              129      78        51     0      21.6  /opt/storage/raw/wcl...
 8 ES              389     136       253     0      63.8  /opt/storage/raw/wcl...
 9 GO              465     213       252     0      80.3  /opt/storage/raw/wcl...
10 MA              381     162       219     0      64.7  /opt/storage/raw/wcl...
# ℹ 17 more rows
# ℹ 2 more variables: Arquivo_Erros <chr>, Arquivo_Sem_Dados <chr>
================================================================

Resumo salvo em:
- /opt/storage/.../ResumoExecucao_ANA_chuva_normal_2_2026-03-11.csv
- /opt/storage/.../ResumoExecucao_ANA_chuva_normal_2_2026-03-11.parquet

End job:  Wed Mar 11 19:13:06 -03 2026
--------------------------------------------------
Download Process Limitations
Although the pipeline demonstrates high operational robustness, certain limitations inherent to the extraction process should be considered when interpreting results and planning future applications.
Access via unauthenticated public WebService
The algorithm operates directly on the public HidroSerieHistorica WebService, without the need for prior authentication. While this broadens the immediate applicability of the tool, unauthenticated access imposes restrictions on the volume of data returned per request. ANA also provides an official API interface (HidroWeb), access to which requires a formal request and institutional evaluation. Integration with this official API could increase the volume of data obtained per request, while maintaining the validation and structuring protocols already established by the pipeline.
Incomplete station registration metadata
A relevant limitation identified in the station inventory concerns the frequent absence of complete registration information, particularly DataFimOperacao. Between 50% and 58% of registered stations lack this information, depending on the data type. Additionally, inconsistencies were identified in which stations with a recorded end-of-operation date still presented observational records in subsequent periods. No data dictionary for the station registration metadata was found in ANA’s publicly available documentation. This scenario reinforces the need for the approach adopted — based on empirical validation of data availability via the WebService — rather than exclusive reliance on static registration metadata.
Institutional repository update latency
The most recent data provided by ANA exhibit variable update latency, particularly for the current year. Recent records may still be undergoing insertion and validation in the national repository at the time of extraction, which can result in incomplete series for periods closest to the extraction date. For this reason, the pipeline adopts 31/12/2024 as the final reference date, even for collections performed in 2025.
WebService operational instability
The ANA institutional WebService may experience occasional instabilities, particularly when subjected to multiple consecutive requests. Tools such as SisCAH, SiADH, and the hydrobr package, although designed for similar purposes, lack explicit fault-tolerance mechanisms and large-scale metadata management, making them vulnerable to these fluctuations. The pipeline mitigates this issue through automatic retry, exponential backoff, and load control mechanisms. However, prolonged instabilities or persistent traffic-overload blocking may still result in residual technical failures, which are recorded in problem_gauges for subsequent auditing.
Regional heterogeneity of the monitoring network
Data availability varies considerably across Brazilian states, reflecting historical differences in the density and continuity of hydrometeorological monitoring networks across the national territory. Regions with lower station coverage, such as parts of the Northeast and the Amazon basin, tend to exhibit more fragmented series and a higher proportion of stations with no data in the analysed period. This heterogeneity is an intrinsic characteristic of the national observational repository and cannot be circumvented by the pipeline, which operates exclusively on the data made available by ANA.
Parallelisation restricted to monthly post-processing
The parallelisation strategy adopted — restricted to monthly post-processing within a single station — represents a deliberate trade-off between performance gain and the stability of requests to the WebService. Parallelising HTTP requests across multiple simultaneous stations would significantly increase the risk of HTTP 429 blocking and could compromise the integrity of the collection. As a result, the performance gain achieved (~26% reduction in total time) reflects this trade-off and is proportionally smaller than what would be expected under full parallelisation.
Alternative data manual download
Daily precipitation data for stations registered with ANA can also be obtained through a manual download process via the open-access HidroWeb system [2]. From HidroWeb it is possible to search for stations by code, name, type, operator, state, or associated river basin. The download is performed individually per station, generating a compressed file (.zip) containing the precipitation data in the requested format (.txt, .csv, or .mdb).
The HidroWeb system also offers the possibility of API access. However, users wishing to access HidroWeb data and information in an automated manner must submit a formal request by e-mail, which will be subject to institutional evaluation.
Download precipitation data: https://www.snirh.gov.br/hidroweb/serieshistoricas
Request API access: https://www.snirh.gov.br/hidroweb/acesso-api
Alternative station listing download via HidroWeb Inventário
The HidroWeb portal also makes available a compressed archive named Inventário at https://www.snirh.gov.br/hidroweb/download. This archive contains an .mdb database file which includes, among others, a table named Estacao that provides the registration data for all stations of both types (1 and 2) in a single file. This represents an alternative to the programmatic approach via the WebService described in this chapter. The raw data extracted from the Estacao table can be submitted to a post-processing workflow analogous to the one implemented in the R script — including type casting, computation of DataInicioOperacao and DataFimOperacao, deduplication by station code, and geographic validation — yielding a clean, deduplicated station listing equivalent to the one produced by the pipeline. The same archive contains the Municipio table, which provides the IBGE municipality code corresponding to each ANA municipality code (see the note in the georeferencing chapter).
Data Provenance, Limitations, and Variable Documentation
Data Versioning
The datasets used in this documentation were produced from two independent download procedures, both carried out against the ANA WebService:
Dataset |
Period covered |
Download date |
|---|---|---|
Station registration inventory — Rainfall |
— |
2025-11-25 |
Station registration inventory — Streamflow |
— |
2025-11-25 |
Historical series — Stage (river level) |
1961–1990 |
2026-02-21 to 2026-02-22 |
Historical series — Stage (river level) |
1991–2020 |
2026-02-23 to 2026-02-25 |
Historical series — Stage (river level) |
2021–2024 |
2026-02-25 to 2026-02-27 |
Historical series — Rainfall (precipitation) |
1961–1990 |
2026-03-03 to 2026-03-04 |
Historical series — Rainfall (precipitation) |
1991–2020 |
2026-03-09 to 2026-03-11 |
Historical series — Rainfall (precipitation) |
2021–2024 |
2026-03-11 to 2026-03-14 |
Historical series — Discharge |
1961–1990 |
2026-03-19 to 2026-03-20 |
Historical series — Discharge |
1991–2020 |
2026-03-23 to 2026-03-25 |
Historical series — Discharge |
2021–2024 |
2026-03-27 to 2026-03-29 |
Source: Original research results.
It is important to note that the ANA station registration inventory is a living dataset: new stations are added, and the registration attributes of existing stations (such as DataInicioOperacao, DataFimOperacao, nmMunicipio, and the set of responsible agencies) may be revised or corrected over time as the agency updates its cadastral records. As a consequence, a query performed on the same WebService endpoint at a different date may return a different number of stations and/or different attribute values for stations that were already registered. Similarly, the historical series data for individual stations may be extended, corrected, or revised retroactively as new field observations are validated and incorporated into the institutional repository. For reproducibility purposes, it is therefore essential to record the exact date on which each download was performed and to treat all derived datasets as snapshots that are tied to their specific extraction date.
Known Limitations of the Inventory
This section summarises the known limitations of the ANA station inventory and the associated historical series data. Limitations specific to the computational download pipeline (retry behaviour, parallelisation constraints, WebService instability) are documented in the Download Process Limitations section of the Computational Pipeline chapter.
Incomplete cadastral documentation
The HidroInventário endpoint returns a fixed set of registration fields for each station. However, the official documentation provided by ANA does not cover all columns present in the returned dataset. Several fields — particularly those related to specific instrument types, administrative sub-categories, and certain operational flags — are not described in any publicly available ANA document identified at the time of this writing.
Standard units of measurement
Information retrieved from the documentation of the new ANA API currently under development to replace the legacy WebService indicates that the standard units of measurement for the downloaded time series are:
Variable |
Unit |
Notes |
|---|---|---|
Precipitation |
mm |
Daily accumulated rainfall in millimetres. |
Stage (water level) |
cm |
Daily river stage in centimetres, referenced to the station datum. |
Discharge |
m³/s |
Daily mean discharge in cubic metres per second. |
Note
These units were identified in the documentation of the new HidroWeb API (available at https://www.snirh.gov.br/hidroweb/acesso-api), which is being developed by ANA to replace the legacy WebService used in this project. They should be treated as the standard reference for interpreting the downloaded data, but users are encouraged to verify unit assignments against station-level metadata when working with individual series, as instrument-specific configurations may occasionally differ.
Municipality code incompatibility
As detailed in the Station Georeferencing: ANA–IBGE 2025 Spatial Integration, the municipality codes present in the ANA inventory (field MunicipioCodigo) use a proprietary coding scheme that is not compatible with the IBGE CD_MUN standard. This incompatibility prevents direct administrative joins between ANA data and any dataset using IBGE municipality codes.
Municipality name data quality
The nmMunicipio field in the ANA inventory presents recurring data quality problems, including truncated names and non-standardized spellings. This field should not be directly used as a reliable identifier for administrative linking without prior validation against the IBGE reference list.
Absence of DataFimOperacao for a large proportion of stations
Between 50% and 58% of registered stations (depending on the station type) do not have a recorded end-of-operation date in the DataFimOperacao field. Additionally, cases were identified in which stations with a recorded DataFimOperacao still presented data in subsequent periods, indicating inconsistencies in the cadastral metadata. For these reasons, the DataFimOperacao field is not used as an eligibility criterion in the data download pipeline.
Variable Dictionary
This section provides reference documentation for the variables present in the station registration dataset and in the historical series data produced by the download pipeline.
Cadastral registration fields (HidroInventário)
The complete list of registration fields returned by the HidroInventário endpoint, along with descriptions for all confirmed fields, is available in the supplementary .csv file distributed alongside this documentation. Where official ANA descriptions were not available, the field is marked as [Not documented].
For the subset of fields with official ANA documentation, the primary reference is the HidroWeb system documentation, available at:
HidroWeb system: https://www.snirh.gov.br/hidroweb/serieshistoricas
New HidroWeb API documentation (under development): https://www.snirh.gov.br/hidroweb/acesso-api
Note
At the time of this writing, a comprehensive, machine-readable data dictionary covering all fields returned by the HidroInventário endpoint was not identified in ANA’s publicly available documentation. The supplementary .csv file provided with this dataset represents the most complete field-level documentation compiled from all institutional sources consulted. Confirmation of field descriptions for the undocumented variables is pending formal enquiry with ANA.
Historical series fields
The historical series datasets produced by the download pipeline (stored in Parquet format, one file per state) contain the following core fields:
Field |
Type |
Unit |
Description |
|---|---|---|---|
|
string |
— |
Unique station code assigned by ANA (8 digits). |
|
date |
— |
Calendar date of the daily observation ( |
|
float |
mm / cm / m³/s |
Daily observed value for the respective variable. |
|
integer |
— |
Quality flag: 0 = Blank, 1 = Observed, 2 = Estimated, 3 = Doubtful, 4 = Accumulated. |
|
integer |
— |
Consistency level: 1 = Raw, 2 = Consistent. |
|
datetime |
— |
Insertion timestamp of the record in the ANA repository. |
References
Contributors
Contributor |
Institution |
Location |
|---|---|---|
Marcos Eustorgio Filho |
Center for Data and Knowledge Integration for Health (CIDACS),
Instituto Gonçalo Moniz, Fundação Oswaldo Cruz
|
Salvador, Brazil |
Danielson Neves |
Center for Data and Knowledge Integration for Health (CIDACS),
Instituto Gonçalo Moniz, Fundação Oswaldo Cruz
|
Salvador, Brazil |